The Best Water Quality by Country
🌊 Global Water Quality 2026
A Comprehensive Analysis of Drinking Water Safety Worldwide
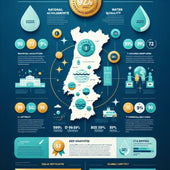
Key Findings
Water quality varies dramatically across the globe, with European nations leading in safety standards while African countries face the most severe challenges. Based on Yale University's Environmental Performance Index (EPI), this analysis reveals critical disparities in access to safe drinking water that directly impact human health and development.
Understanding the Global Water Crisis
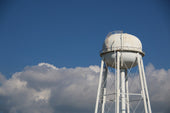
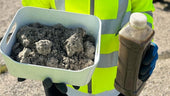
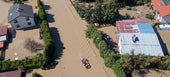
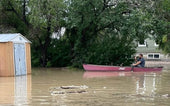
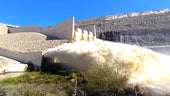
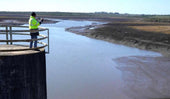
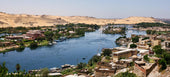
Water quality is arguably the most essential requirement for the survival of all terrestrial life on Earth. Despite its critical importance, access to safe drinking water is not guaranteed and varies considerably throughout the world's countries, influenced by both natural conditions and human activities.
(7 European Countries)
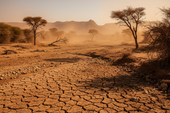
(Chad)
Analyzed
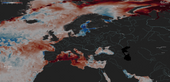
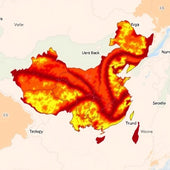
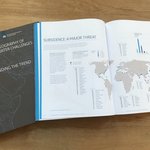
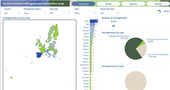
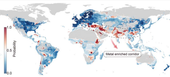
Interactive World Map: Water Quality by Country
The map below displays the EPI Safe Drinking Water Score for countries worldwide. Darker blue indicates higher water quality (safer drinking water), while red indicates poor water quality.
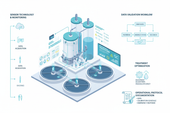
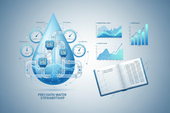
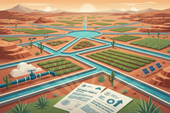
Methodology: How Water Quality is Measured
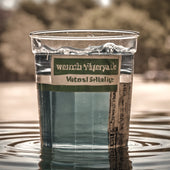
The Environmental Performance Index (EPI) from Yale University measures water quality using the DALY rate - disability-adjusted life-years lost per 100,000 persons due to exposure to unsafe drinking water. This comprehensive metric captures both mortality and morbidity from waterborne diseases.
Score Interpretation:
- 100 points: Countries with the purest, least-contaminated water
- 0 points: The 5% of countries with the most contaminated water
Top Performers: Countries with the Cleanest Water
Seven countries achieved a perfect score of 100.0, representing the highest standard of drinking water safety. All are located in Europe, demonstrating the region's advanced water infrastructure and stringent quality standards.
The Excellence Club (100.0 Score)
- Germany: Advanced water treatment facilities and rigorous testing protocols
- United Kingdom: Comprehensive water quality monitoring and infrastructure investment
- Italy: Strong regulatory framework and natural water source protection
- Greece: Well-maintained distribution systems and quality assurance
- Switzerland: Alpine water sources combined with world-class treatment
- Finland: Pristine natural water sources and effective management
- Ireland: Clean natural resources and modern treatment systems
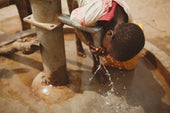
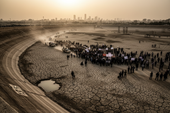
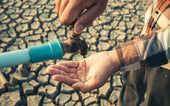
The Water Quality Challenge: Countries Facing Critical Issues
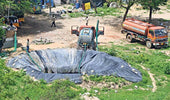
The 10 countries with the lowest water quality scores are all located in Africa, highlighting the severe water crisis affecting the continent. These nations face multiple challenges including inadequate infrastructure, limited resources for water treatment, and vulnerability to contamination.
Critical Concern Countries (Bottom 10)
- Chad (4.6): Severe water scarcity and contamination issues
- Central African Republic (9.2): Limited infrastructure and political instability
- Lesotho (9.8): Geographic challenges and resource constraints
- Niger (12.8): Desert climate and minimal water treatment facilities
- Madagascar (13.5): Rural access challenges and contamination
- Nigeria (14.5): Infrastructure gaps despite being Africa's most populous nation
- Burkina Faso (16.3): Sahel region water stress
- Eritrea (16.6): Limited water resources and treatment capacity
- Burundi (17.5): High population density straining resources
- Malawi (17.8): Lake-dependent nation facing contamination issues
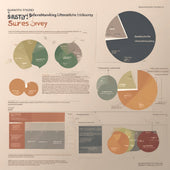
Regional Analysis: Water Quality by Continent
Continental Patterns
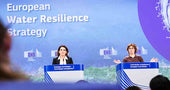
Europe: Leads globally with the highest concentration of perfect scores. Nearly all European nations score above 70, reflecting decades of investment in water infrastructure, strict regulatory frameworks, and advanced treatment technologies.
Africa: Faces the most severe challenges with 10 of the bottom 10 countries located on the continent. Water scarcity, lack of treatment infrastructure, political instability, and rapid population growth compound the crisis.
Asia: Shows extreme variation, from Singapore's 98.7 score to Afghanistan and Bangladesh in the 30s. Economic development level strongly correlates with water quality in this diverse region.
Americas: North America maintains high standards (Canada 99.7), while Latin America and the Caribbean show mixed results. Uruguay (74.4) leads South America, while Haiti (18.5) struggles significantly.
Oceania: Australia (99.2) and New Zealand (85.7) maintain excellent water quality, while Pacific island nations face unique challenges related to climate change and limited freshwater resources.
The Human Impact: Understanding DALY
The DALY (Disability-Adjusted Life Year) metric provides a comprehensive view of water quality's impact on human health. For example, if someone contracts a waterborne disease at age 30, experiences decreased health for five years, and dies ten years earlier than expected, they have lost 15 years of healthy life due to contaminated water. This metric captures both the immediate mortality and the long-term burden of disease.
Key Factors Affecting Water Quality
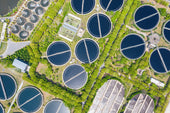
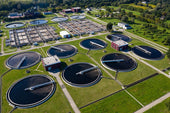
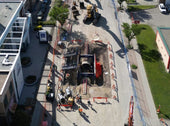
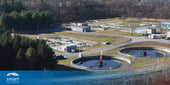
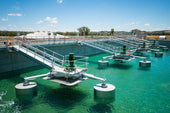
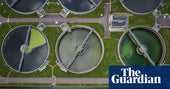
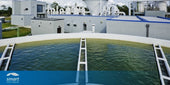
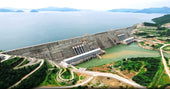
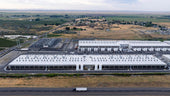
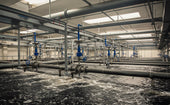
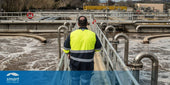
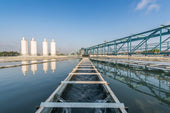
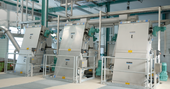
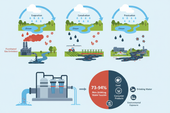
1. Infrastructure & Treatment Facilities
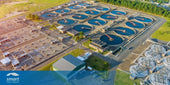
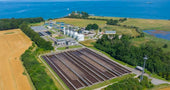
Countries with advanced water treatment infrastructure, including filtration systems, chemical treatment, and distribution networks, consistently achieve higher scores. Investment in maintenance and upgrades is crucial for sustained quality.
2. Economic Development
There's a strong correlation between a nation's economic status and water quality. Developed countries have resources for comprehensive testing, treatment, and distribution systems, while developing nations often lack basic infrastructure.
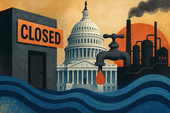
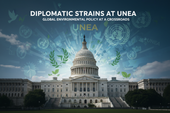
3. Governance & Regulation
Effective water quality management requires strong regulatory frameworks, consistent enforcement, and transparent monitoring. Countries with robust environmental policies tend to maintain higher water quality standards.
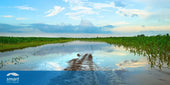
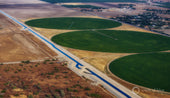
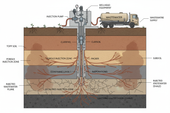
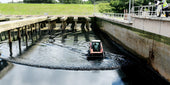
4. Natural Resources
Access to clean natural water sources, such as protected aquifers, mountain springs, and unpolluted rivers, provides advantages. However, even pristine sources require proper management and protection from contamination.
5. Population Pressure
Rapid urbanization and population growth strain existing water systems. Developing countries facing explosive population increases often struggle to expand infrastructure quickly enough to maintain quality standards.
Distribution Analysis
The Path Forward: Solutions and Recommendations
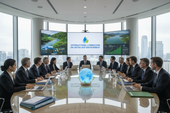
Global Action Required
Addressing the global water quality crisis requires coordinated international efforts, substantial investment, and commitment to sustainable development goals. The stark disparities revealed in this analysis demand urgent attention.
Recommended Actions:
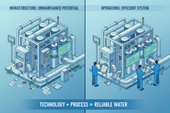
- Infrastructure Investment: Prioritize funding for water treatment facilities, distribution networks, and testing laboratories in low-scoring countries
- Technology Transfer: Share advanced water treatment technologies and best practices from high-performing nations
- Capacity Building: Train local water management professionals and technicians
- International Aid: Increase development assistance focused specifically on water infrastructure
- Climate Adaptation: Develop resilient water systems that can withstand climate change impacts
- Community Engagement: Involve local communities in water source protection and management
- Regulatory Strengthening: Establish and enforce water quality standards aligned with WHO guidelines
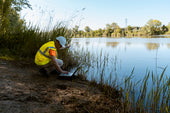
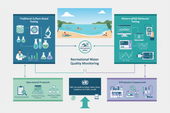
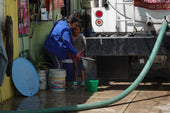
Testing and Monitoring Approaches
In developed countries, water quality testing is typically conducted by water utilities or various local, state, and federal agencies with regular, systematic protocols. In developing and least-developed countries, testing may be much less consistent and reliable, contributing to the quality challenges these nations face.
Conclusion
The 2026 water quality analysis reveals a world of stark contrasts. While seven European nations have achieved near-perfect water quality, billions of people in Africa and parts of Asia continue to lack access to safe drinking water. This disparity is not merely a statistic—it represents millions of preventable deaths and countless years of human potential lost to waterborne diseases.
The path to universal access to safe drinking water requires sustained commitment from the international community, significant investment in infrastructure, and the political will to prioritize this fundamental human right. The technology and knowledge exist to solve this crisis; what's needed now is the collective determination to implement solutions at scale.
As we progress through 2026, the imperative is clear: water quality must be recognized not just as an environmental issue, but as a fundamental determinant of human development, health, and dignity. Every person, regardless of their location or economic status, deserves access to clean, safe drinking water.
Data Source: Environmental Performance Index (EPI), Yale University, 2024
Methodology: EPI Safe Drinking Water Score based on disability-adjusted life-years (DALY) lost per 100,000 persons due to unsafe drinking water exposure
Analysis Date: January 2026