$515 Billion in Water Infrastructure Investment: Why 80% Won't Deliver Without Operational Excellence
$515 Billion in Water Infrastructure Investment: Why 80% Won't Deliver Without Operational Excellence
escore Water | Finance | January 2026
The numbers are staggering. According to Bluefield Research, U.S. municipal water and wastewater utilities will invest $515.4 billion in capital expenditure through 2035. At $57.3 billion annually with 4.4% compound growth, this represents one of the largest infrastructure investment cycles in American history.
But here's the uncomfortable truth that Bluefield's analysis reveals: nearly 80% of this spending—$406.4 billion—is going toward rehabilitation of existing assets. Not expansion. Not innovation. Simply trying to keep aging infrastructure functional.
This pattern exposes a fundamental problem in how utilities approach infrastructure management: they are trapped in a cycle of reactive fixes rather than systematic operational excellence. And without addressing that underlying dysfunction, much of this $515 billion investment will deliver far less value than it should.
The Investment Breakdown
The Bluefield forecast divides the investment between two primary segments, with wastewater commanding the larger share:

Wastewater dominates at $310.4 billion (58%) due to sewer system expansion, advanced treatment technology adoption, and combined sewer overflow mitigation. Drinking water investment of $214 billion (42%) is growing faster at 4.72% CAGR—driven largely by anticipated PFAS compliance costs and storage mandates forcing system-wide upgrades.
The Rehabilitation Problem: 80% Going to Fixes, Not Innovation

Charlie Suse, senior analyst at Bluefield Research, captures the core challenge: "Given the mounting challenges, utilities need to identify ways to transition from reactive fixes to more advanced long-term asset strategies that improve resilience and contain costs."
When 80% of spending goes to rehabilitation rather than strategic improvement, it signals that assets are failing faster than they should—a direct consequence of inadequate operational protocols. The $406 billion rehabilitation bill represents accumulated operational dysfunction.
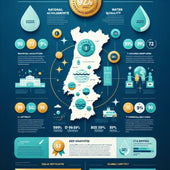
Regional Distribution: Two Distinct Challenges

The South accounts for 44% of total spending—approximately $227 billion—led by Texas and Florida, where rapid suburban expansion is driving new facility construction. These are growth-driven investments responding to demographic pressure.
But the fastest growth is projected in smaller states like Connecticut, Washington, and Maine—where aging infrastructure, demographic shifts, and tightening regulations are converging. These utilities represent deferred maintenance catching up with operational reality.
Federal Funding Failure: Only 14% Deployed

Perhaps the most damning statistic: as of April 2025, only 14% of the $43.6 billion appropriated for State Revolving Fund programs through the Infrastructure Investment and Jobs Act had reached project deployment. Half of all project awards concentrated in just seven states.
This deployment failure reflects the same operational dysfunction that plagues utility asset management. The funding exists. The need is documented. But the systematic frameworks for translating appropriations into functioning projects are missing.
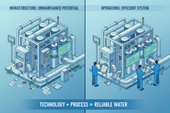
The ROI Case for Operational Excellence

Consider the economics. A utility might approve a $50 million treatment plant upgrade while resisting a $200,000 investment in operational checklists and systematic monitoring protocols. Yet research consistently shows that utilities with robust operational frameworks achieve 15-20% water loss rates, while those without systematic protocols often experience 30-40% losses.
The ROI on operational excellence investments runs 400-800%—dwarfing returns on capital infrastructure alone. A $500,000 operational excellence program delivering 600% ROI generates $3 million in value.
Projected Growth Trajectory

Annual CAPEX will grow from $57.3 billion today to approximately $87 billion by 2035. This investment wave is coming regardless of what individual utilities do. The question is whether organizations will capture full value from their share.
The Mid-Size Utility Opportunity
Bluefield identifies mid-sized utilities—those serving 25,000 to 100,000 people—as the "sweet spot" for adopting modular and scalable treatment technologies. This observation extends equally to operational excellence frameworks.
Large utilities often have in-house capabilities but suffer from institutional inertia. Small utilities lack capital for any systematic improvements. Mid-sized systems have both the resources to implement change and the organizational flexibility to execute it.
What This Means for Utility Leaders
Key questions for utility executives and board members:
- What percentage of your capital spending goes to rehabilitation versus strategic improvement?
- Do you have systematic protocols for asset management, or are you operating in reactive mode?
- What is your water loss rate compared to industry benchmarks?
- Are your technology investments supported by operational frameworks that will make them perform consistently?
The Bottom Line
The $515 billion investment wave is coming regardless of what individual utilities do. The question is whether your organization will capture full value from its share—or continue the expensive cycle of reactive rehabilitation that made this spending necessary in the first place.
Boring management beats heroic technology.
Data Source: Bluefield Research, "Municipal Capital Expenditure Forecast 2025-2035," May 2025. Via Water Finance & Management.