Improving how we track progress for river protection
Research & Analysis • January 2026
Rethinking River Protection
Why traditional metrics are failing our freshwater ecosystems—and what new frameworks reveal about the true state of America's rivers
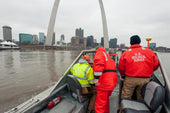
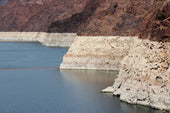
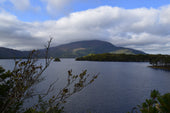
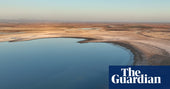
The statistics are staggering: freshwater species populations have declined by 85% since 1970, more than any other ecosystem on Earth. Yet despite decades of conservation efforts, we've struggled to accurately measure whether our river protection strategies are actually working. A landmark 2026 study from Conservation Science Partners and American Rivers is changing that—and the findings should concern everyone who cares about water.
The Measurement Problem
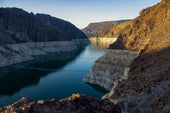
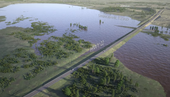
For years, conservationists have relied on a simple approach: count how many river miles flow through protected lands like national parks and wilderness areas. If rivers pass through protected territory, they must be protected, right?
Not exactly.
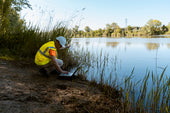
The Protected Rivers Assessment of the United States represents the most comprehensive evaluation of river protection ever conducted in the country. Researchers evaluated more than 7 million kilometers of rivers and identified nearly 70 different protection mechanisms—from federal designations and state policies to local ordinances and private conservation easements.
— Julian Olden, Conservation Science Partners
Only 12% of U.S. Rivers Are Adequately Protected
The assessment introduces a new Protected River Index (PRI) that measures protection across five key ecological attributes essential for healthy rivers:
- Free-flowing conditions — unimpeded by dams
- Longitudinal connectivity — ability for species to move upstream/downstream
- Water quality — protection from pollution sources
- Riparian habitat — intact streamside vegetation and buffers
- Biodiversity — support for native species populations
U.S. River Protection Status
Percentage of 4.4 million river miles by protection level
Under this more rigorous framework, only about one-tenth of rivers in the contiguous United States—roughly 383,741 miles—are protected at a level considered viable by the scientific community. That's out of 4.4 million total river miles.
⚠️ Critical Finding
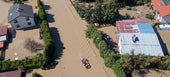
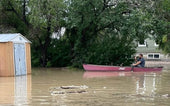
110 million Americans rely on rivers that are completely unprotected for their drinking water supply.
The Disconnect Between Land and Water
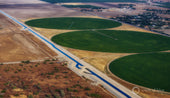
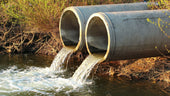
One of the study's most significant findings is the mismatch between terrestrial protected areas and actual river protection. Traditional land-based conservation measures often fail to address the unique characteristics of freshwater ecosystems.
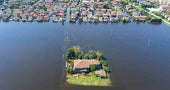
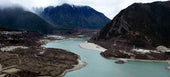
Rivers don't respect boundaries. They flow across jurisdictions, connect distant landscapes, and depend on conditions far upstream. A river segment flowing through a national park might still be affected by agricultural runoff miles away or blocked by a dam downstream.
National parks alone protect 130,000 miles of rivers—about 3% of the nation's total. Of all protected rivers in the country, roughly one-tenth flow through national parks, demonstrating their outsized importance in river conservation where other mechanisms prove inadequate.
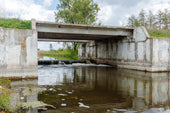
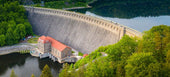
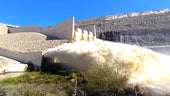
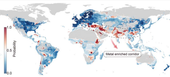
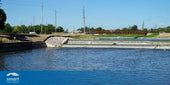
The Dam Problem
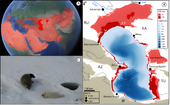
River fragmentation from dams remains one of the greatest threats to freshwater ecosystems. The numbers paint a troubling picture: 63% of the world's longest rivers are no longer free-flowing, and more than 50,000 dams impede rivers across the contiguous United States alone.
Global Free-Flowing River Status
Only rivers over 1,000 km in length
The Wild and Scenic Rivers Act, signed in 1968, remains the nation's strongest form of protection for free-flowing rivers. Yet after more than 50 years, the system protects just 228 rivers totaling 13,467 miles—less than 0.5% of all U.S. river miles.
Wild & Scenic Rivers vs. Total U.S. Rivers
Protected miles as percentage of 4.4 million total
Freshwater Biodiversity in Crisis
The consequences of inadequate protection are visible in biodiversity data. According to the 2024 Living Planet Report, monitored freshwater species populations have declined 85% since 1970—far exceeding the declines in terrestrial (69%) and marine (56%) ecosystems.
Wildlife Population Decline by Ecosystem
Average decline in monitored populations, 1970-2020
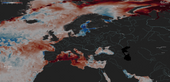
Migratory freshwater fish have been hit especially hard, with populations down 81% globally. Regional variations are stark: Latin America and the Caribbean have seen a catastrophic 91% decline, while Asia-Oceania shows a 28% decrease.
Migratory Freshwater Fish Decline by Region
Population decline from 1970-2020
The primary drivers include habitat loss and degradation (accounting for about half of threats), overexploitation, invasive species, pollution, and increasingly, climate change.
A Path Forward: The 30x30 Framework
The global 30x30 initiative—protecting 30% of land, freshwater, and ocean by 2030—provides a framework for accelerating river conservation. The Kunming-Montreal Global Biodiversity Framework, adopted by over 190 countries in 2022, explicitly includes inland waters in its protection targets.
Progress Toward 30x30 Goals
Current protection levels vs. 2030 targets
For freshwater ecosystems, this will require moving beyond traditional protected area approaches. The research highlights several priorities:
- Dedicated freshwater protection mechanisms — Rivers need protections designed specifically for their dynamic, connected nature
- Upstream-downstream coordination — Protection efforts must account for threats that originate outside protected boundaries
- Whole-basin thinking — Effective conservation requires managing entire river systems, not isolated segments
- Integration of multiple mechanisms — Combining federal, state, and local protections creates more durable outcomes
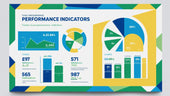
What Water Managers Can Do
Key Statistics at a Glance
| Metric | Value |
|---|---|
| U.S. rivers adequately protected | ~12% |
| Rivers completely unprotected | ~66% |
| Wild and Scenic River miles | 13,467 |
| Total U.S. river miles | 4.4 million |
| Freshwater species decline (since 1970) | 85% |
| Migratory fish decline (since 1970) | 81% |
| World's longest rivers still free-flowing | 37% |
| Americans relying on unprotected rivers | 110 million |
The Bottom Line
We can't protect what we don't measure. The Protected Rivers Assessment gives us, for the first time, a comprehensive picture of where American rivers stand—and the picture demands attention.
With 110 million Americans relying on unprotected rivers for drinking water and freshwater species declining faster than any other group, the urgency is clear. The new assessment framework provides the tools to evaluate current protections, identify gaps, and prioritize investments that will actually make a difference.
The next few years will determine whether we meet global conservation targets or watch our freshwater ecosystems continue to unravel. Armed with better data and clearer metrics, we finally have the opportunity to get river conservation right.
Sources & Further Reading
- Comte, L., Olden, J.D., et al. (2026). National assessment of river protection in the United States. Nature Sustainability.
- Olden, J.D., Comte, L., et al. (2026). Safeguarding, strengthening and expanding river protections for nature and people. Nature Sustainability.
- WWF (2024). Living Planet Report 2024.
- Deinet, S., et al. (2024). The Living Planet Index for Migratory Freshwater Fish.
- Grill, G., et al. (2019). Mapping the world's free-flowing rivers. Nature.
- Conservation Science Partners. Protected Rivers Explorer. csp-inc.org
- Rivers.gov. National Wild and Scenic Rivers System Statistics.